Helping independent musicians leverage data across platforms
Timeline
Summer 2023 (8 weeks)
My Role
I worked with 3 other designers throughout the course of this project. I took the lead on developing the design language, prototyping, and documentation for handoff.
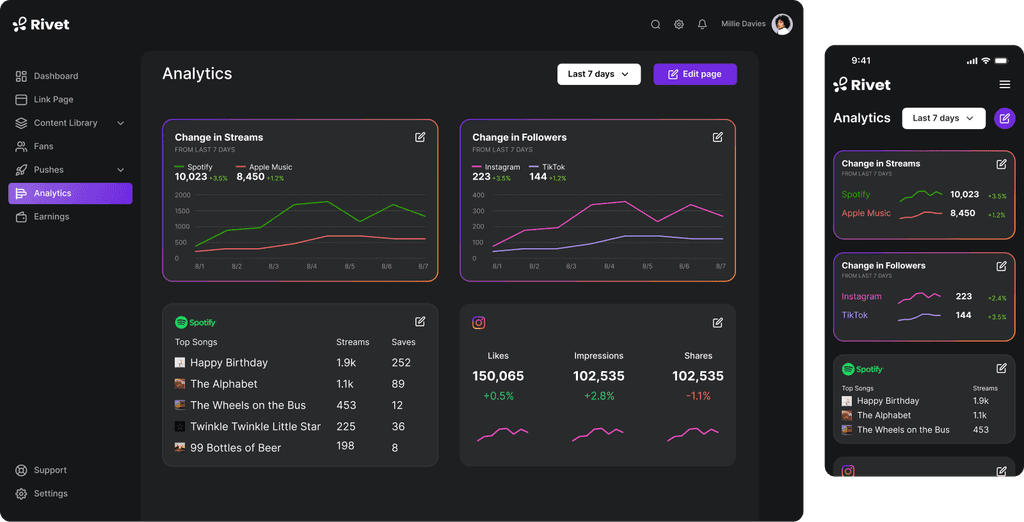
Final deliverable: the new Rivet analytics dashboard.
Context
Rivet is a pre-seed startup that helps independent musicians spend less time marketing and more time focusing on their craft by providing actionable recommendations to monetize their audiences.
Rivet’s product only tracked individual-level fan interactions across a small number of integrated platforms, and they were interested in expanding the product’s capabilities to take advantage of aggregate-level data from a wider range of platforms that artists use. The goal was to make Rivet a one-stop shop for data and strategy.
Project and deliverables
With my team, I designed a new feature leveraging flexible, widget-based data visualizations to help users quickly monitor and compare metrics across a range of social media, streaming, and sales platforms.
I conducted research, generated, tested, and prototyped concepts, and documented a final prototype to hand off to Rivet’s executive team.
Impact
This feature gives Rivet the opportunity to become a one-stop shop for musician data. Digestible data visualizations for a wide range of integrated services creates a new entry point to attract and retain users who could take advantage of Rivet's core product without needing to use a separate, paid product to monitor data across platforms.
In addition, the integration of aggregated data would bolster Rivet’s existing individual-level data management solution by providing new, rich data to feed Rivet's recommendations.
Helping the self-marketer leverage data
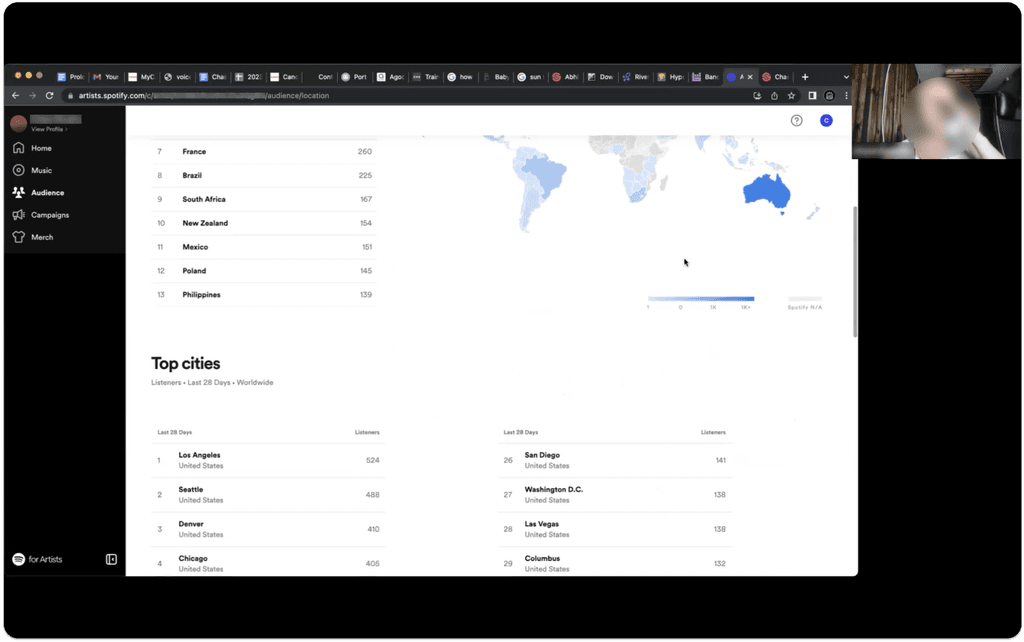
Through contextual inquiries with independent musicians, we learned that they monitor several platforms to understand how they're doing with fans. The platforms they focus on can vary from musician to musician, and can also vary over time; for example, if an artist goes viral on a specific platform.
Independent musicians often do their own marketing—every single one we talked to said they wanted to use more data, but they didn't always know how.
Conducting a contextual inquiry with an artist to learn their process for monitoring their data.
Finding a niche in the market
Our team found other platforms for monitoring data from different sources. Some of our research participants even used them. But they tended to be far more robust than the musicians we talked to needed, and the data-heavy experience was too much for some with lower data literacy.
With this in mind, we focused on making something quick and approachable while still maximizing value.
The end goal was to create a feature that would bring more users in, integrate well with Rivet's existing platform for individual fan-level data, and get rid of the need for users to go to other platforms to monitor their aggregate data.
Digestible data visualizations
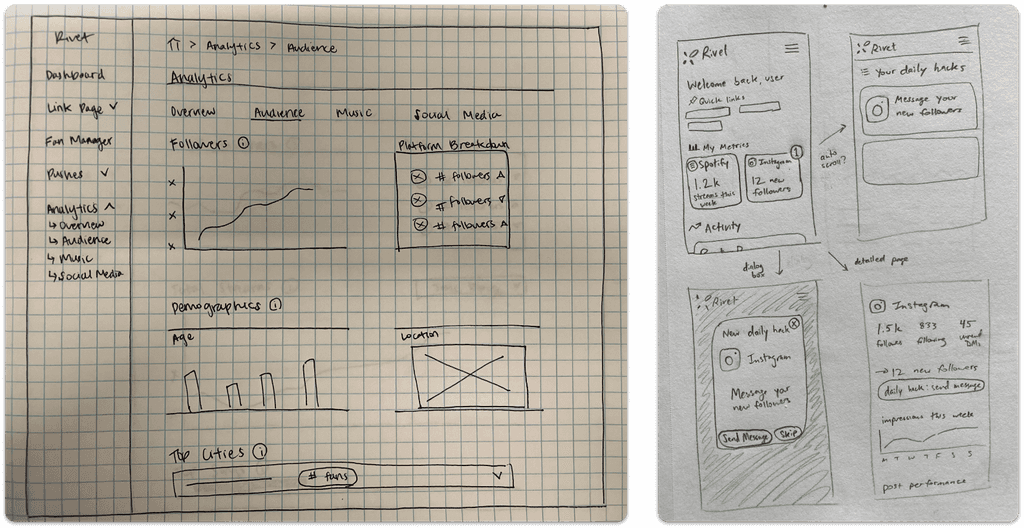
Using these insights, we began brainstorming ways to show aggregate-level data from streaming platforms and other sources all in one place, and in a digestible format. We explored traditional dashboards, widgets for quick information from individual platforms, and other solutions like email reports.
Early sketches exploring widgets and traditional dashboard layouts.
Concept testing
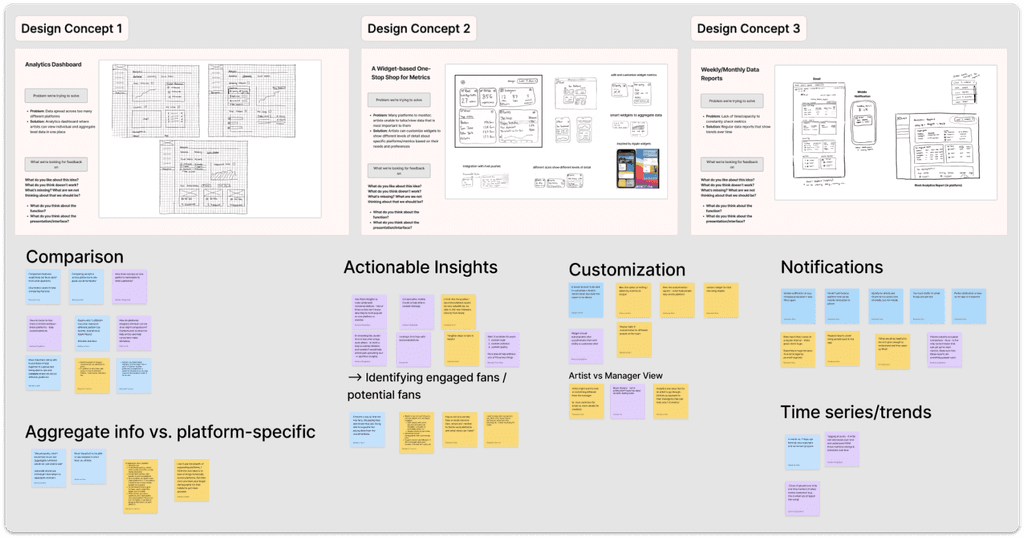
Through concept testing with managers of small artists, we got a second set of perspectives on how data could be consumed and leveraged quickly by individuals and small teams.
Analyzing notes from a concept test in which we compared participant reactions to 3 of our ideas.
Widgets
We moved forward with my idea for simple, customizable widgets due to the positive feedback from artists and managers, the flexibility it offered, and the feasibility of implementing the idea into Rivet's existing platform.
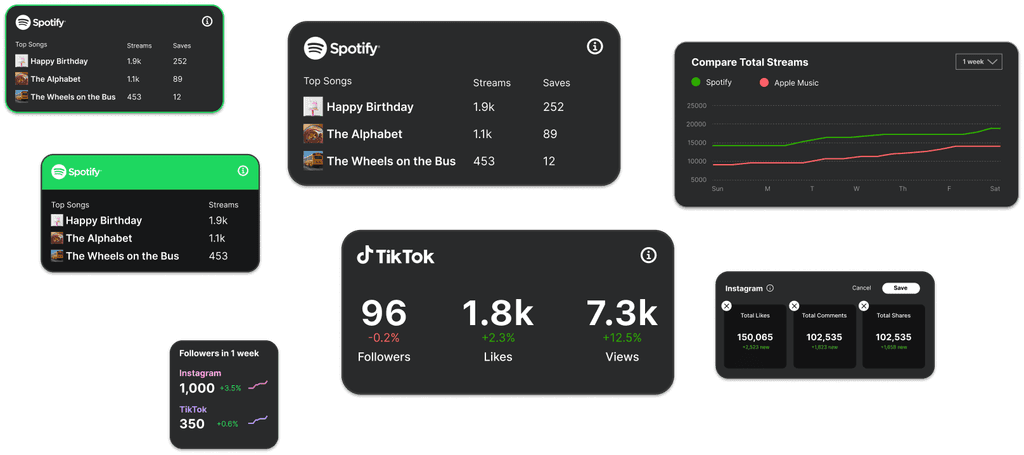
I prototyped widgets for the most common platforms that artists monitored, such as Spotify, Apple Music, Instagram, and TikTok, as well as widgets to compare common metrics (such as streams, comments, and impressions) across multiple platforms.
With widgets, artists could choose to integrate only the platforms they cared about, and could easily change key platforms and metrics as their needs changed.
Once we settled on a widget-based design, I explored various layouts for data from popular platforms.
Customizability
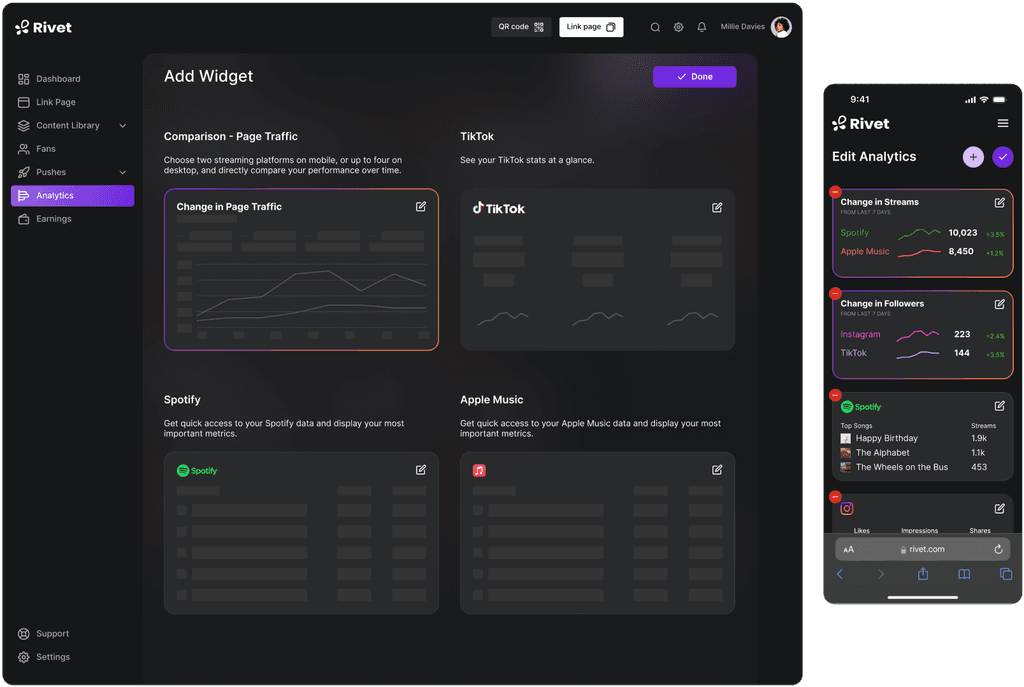
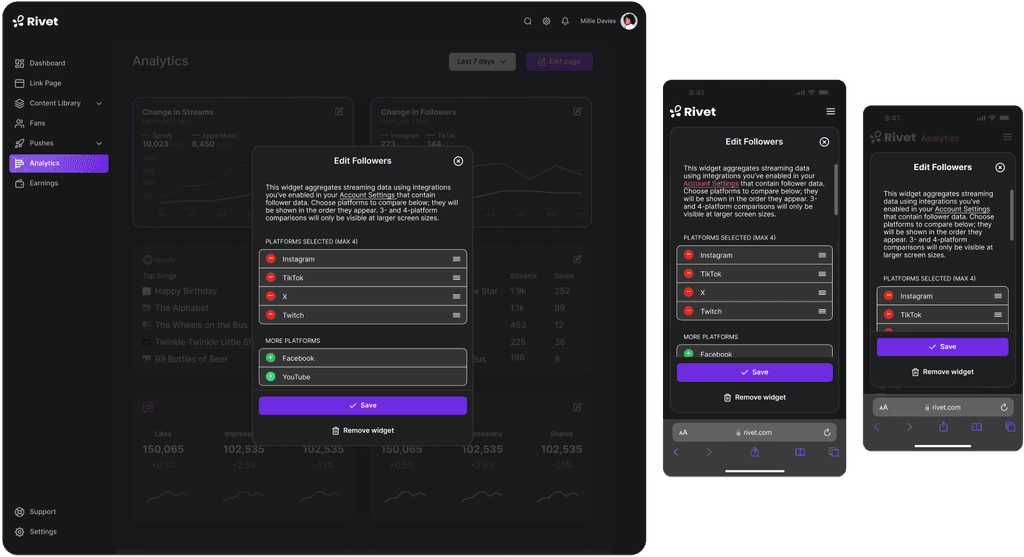
To develop the idea further, I designed flows for adding, removing, and reordering widgets, as well as changing the specific metrics shown in each widget.
Prototyping ‘add’ and ‘edit’ modes for the widget dashboard.
Responsiveness for the mobile musician
We knew from client research that 90% of users were accessing Rivet's existing platform from their phones, so we prioritized mobile versions of the web app and designed across multiple different mobile and desktop sizes.
I focused on making a responsive system that scaled to fit various screen sizes.
Handoff
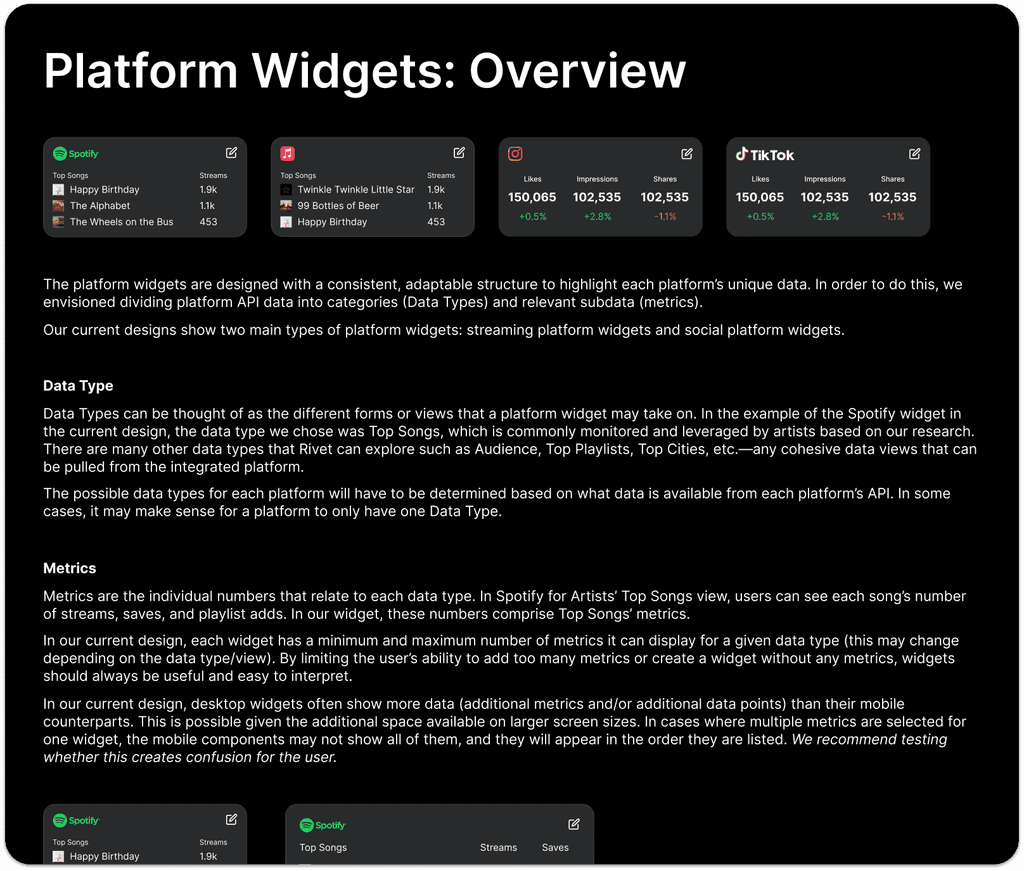
At the end of the project, I designed documentation pages for handoff to executive team, which explained the new features and the decisions behind them so that they could build on our work.
I wrote documentation for the feature to include in our handoff to Rivet’s executive team.
Reflection
This project was an exciting opportunity to design a completely new feature for a fast-growing startup. With an eight-week timeframe, our team had to work quickly and communicate effectively in order to deliver a cohesive product with multiple parts.
I'm thankful to have had the chance to practice critique, strategic discussion, and rapid prototyping on an exciting project with the potential to help small creators.
